对于Android程序,我们一般使用java语言进行开发,当程序出现uncaught exception的时候,我们可以通过Thread.setDefaultUncaughtExceptionHander()或者是Thread.setUncaughtExceptionHandler() 方法来捕获相关的异常,并记录与之相关的信息并上传到服务器进行分析。如果Android程序中包含native code或者说当相关的native code出现问题的时候,我们怎么才能将相关的call stack信息保存起来以便之后进行分析呢?
同时可以看到,我们在编译Brillo项目的时候,在生成可执行文件(exe)或者动态链接库(.so)之后,又会在${OUT}/breakpad/目录下生成.sym文件。这个文件又有什么用呢?
这时,我们需要google-breakpad:由于google-breakpad在android-6.0上才加入到项目,对于android-6.0之前的版本可能支持不太好。需要再进一步分析。
- 建立相关环境
主机使用ubuntu-14.04系统,Brillo系统使用的是分支为brillo-m9-dev:
$ . build/envsetup.sh
$ lunch brilloemulator_arm-eng
在编译完项目之后,可以看到在out/target/product/brilloemulator_arm文件夹下,有一个breakpad文件夹。
- 如何生成.sym文件
以webservd模块为例,在编译的时候加showcommands参数可以看到编译时所执行的命令:
$ touch system/webservd/webservd/main.cc
$ mmm system/webservd/ showcommands
...
[ 71% 5/7] /bin/bash -c "(true) && (mkdir -p out/target/product/brilloemulator_arm/breakpad/system/bin/) && (out/host/linux-x86/bin/dump_syms -c out/target/product/brilloemulator_arm/obj/EXECUTABLES/webservd_intermediates/PACKED/webservd > out/target/product/brilloemulator_arm/breakpad/system/bin/webservd.sym)"
...
可以看出webservd.sym文件是由通过out/host/linux-x86/bin/dump_syms生成的,那么dump_syms又是哪里来的呢。通过mgrep命令查找之后,我们知道是由external/google-breakpad/下面的代码生成的。
- 使用breakpad进行in-process core dump
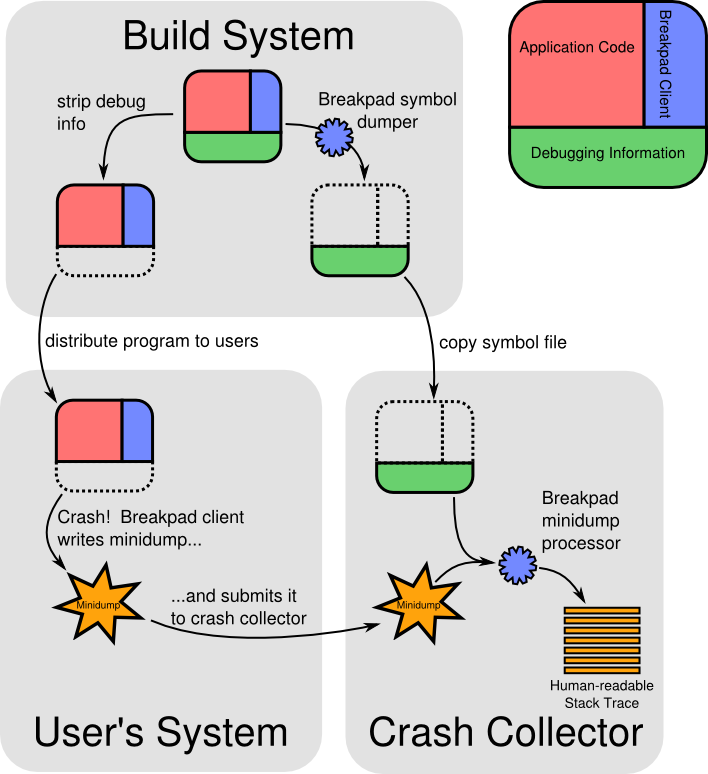
(图片来自:https://chromium.googlesource.com/breakpad/breakpad/+/master/docs/breakpad.png)
- breakpad – demo app
在external/google-breakpad/android/sample_app下面有一个demo app, 我们来看一下这个app是做什么的。代码如下:
// ...
namespace {

bool DumpCallback(const google_breakpad::MinidumpDescriptor& descriptor,
                  void* context,
                  bool succeeded) {
  printf("Dump path: %s\n", descriptor.path());
  return succeeded;
}

void Crash() {
  volatile int* a = reinterpret_cast<volatile int*>(NULL);
  *a = 1;
}

}  // namespace

int main(int argc, char* argv[]) {
  google_breakpad::MinidumpDescriptor descriptor(".");
  google_breakpad::ExceptionHandler eh(descriptor, NULL, DumpCallback,
                                       NULL, true, -1);
  Crash();
  return 0;
}
可以看到这些代码生成的可执行文件在运行时会crash同时会生成mini dump文件。
- breakpad – 编译demo app
我们先看一下如何编译sample_app(external/google-breakpad/android/sample_app): test_google_breakpad。项目中使用NDK进行编译。我们来看一下在没有NDK的情况下如何在项目中进行编译:
$ cd external/google-breakpad
$ cp android/sample_app/jni/test_breakpad.cpp test_breakpad.cc
$ cat << EOF >> Android.mk

# test_google_breakpad binary.
# =================================================
include \$(CLEAR_VARS)

LOCAL_MODULE := \\
    test_google_breakpad

LOCAL_CPP_EXTENSION := .cc

LOCAL_SRC_FILES := \\
    src/client/linux/crash_generation/crash_generation_client.cc \\
    src/client/linux/handler/exception_handler.cc \\
    src/client/linux/microdump_writer/microdump_writer.cc \\
    src/client/linux/log/log.cc

LOCAL_SRC_FILES += \\
    test_breakpad.cc

LOCAL_STATIC_LIBRARIES += breakpad_client

LOCAL_SHARED_LIBRARIES += \\
    liblog

include \$(BUILD_EXECUTABLE)
EOF

$ mm
最后,生成了我们所需要的文件:out/target/product/brilloemulator_arm/system/bin/test_google_breakpad。
- breakpad – 运行demo app
我们先将编译生成的可执行文件集成到system image中并运行brillo emulator:
$ m snod
$ brilloemulator-arm -m 256
由于在执行demo app时,会在当前目录下生成mini dump文件,所以要保证当前目录下是可写的。执行:
$ adb shell
# cd /data/local/tmp/
# test_google_breakpad
Dump path: ./5a5a4c58-3f2f-3ab2-760df4d0-18d1a72b.dmp
Dump path: ./5a5a4c58-3f2f-3ab2-760df4d0-18d1a72b.dmp
[1] + Stopped (signal)     test_google_breakpad
可以看到生成了5a5a4c58-3f2f-3ab2-760df4d0-18d1a72b.dmp文件,我们再来看一下文件的内容:
$ cd out/target/product/brillemulator_arm
$ adb pull /data/local/tmp
$ hexdump -C -v tmp/5a5a4c58-3f2f-3ab2-760df4d0-18d1a72b.dmp
00000000  4d 44 4d 50 93 a7 00 00  0d 00 00 00 20 00 00 00  |MDMP........ ...|
00000010  00 00 00 00 9f 7a c0 56  00 00 00 00 00 00 00 00  |.....z.V........|
00000020  03 00 00 00 34 00 00 00  c0 00 00 00 04 00 00 00  |....4...........|
00000030  3c 04 00 00 68 13 00 00  05 00 00 00 24 00 00 00  |<...h.......$...|
00000040  d0 1b 00 00 06 00 00 00  a8 00 00 00 f8 1b 00 00  |................|
00000050  07 00 00 00 38 00 00 00  a0 1c 00 00 03 00 67 47  |....8.........gG|
00000060  34 01 00 00 50 1d 00 00  04 00 67 47 7d 03 00 00  |4...P.....gG}...|
00000070  88 1e 00 00 00 00 00 00  00 00 00 00 00 00 00 00  |................|
00000080  06 00 67 47 15 00 00 00  08 22 00 00 07 00 67 47  |..gG....."....gG|
...
所以,我们还需要一个工具来解析这个文件,以生成我们能够看得懂的文本信息。我们需要minidump_stackwalk。
- breakpad – minidump_stackwalk
可以从external/google-breakpad代码中编译生成:
$ cd external/google-breakpad
$ mkdir build && cd build
$ ../configuration
$ make
最终会在src/processor/(完整路径为: external/google-breakpad/build/src/processor/minidump_stackwalk)下面生成我们所需要的文件。
当然,你可以使用make check看一下生成的文件有没有问题:
hzak@B85PRO:/local/brillo-m9-rpi/external/google-breakpad/build$ make check
...
============================================================================
Testsuite summary for breakpad 0.1
============================================================================
# TOTAL: 35
# PASS:  35
# SKIP:  0
# XFAIL: 0
# FAIL:  0
# XPASS: 0
# ERROR: 0
============================================================================
make[2]: Leaving directory `/local/brillo-m9-dev/external/google-breakpad/build'
make[1]: Leaving directory `/local/brillo-m9-dev/external/google-breakpad/build'

#### make completed successfully (07:58 (mm:ss)) ####
有了minidump_stackwalk之后,我们还需要处理一下breakpad文件:
$ cd out/target/product/brilloemulator_arm
$ cat << EOF > breakpad_to_syms.sh
#! /bin/bash
set -e

BP_DIR=\`pwd\`/breakpad
CV_DIR=syms

if [ ! -d \${CV_DIR} ] ; then
    mkdir \${CV_DIR}
fi

for item in \$(find \${BP_DIR} -type f -name '*.sym' )
do
    version=\`head -n 1 \$item | awk '{ print \$4 }'\`
    folder=\${CV_DIR}/\`basename \$item | sed 's/.sym\$//g'\`/\$version
    mkdir -p \$folder
    ln -sv \$item \$folder
done
EOF
$ chmod a+x breakpad_to_syms.sh
$ ./breakpad_to_syms.sh
将breakpad文件结构转换成minidump_stackwalk之后,我们就可以对dmp文件进行转换了:
hzak@B85PRO:/local/brillo-m9-dev/out/target/product/brilloemulator_arm$ ../../../../external/google-breakpad/build/src/processor/minidump_stackwalk tmp/5a5a4c58-3f2f-3ab2-760df4d0-18d1a72b.dmp syms/
2016-02-14 22:49:58: minidump.cc:4035: INFO: Minidump opened minidump tmp/5a5a4c58-3f2f-3ab2-760df4d0-18d1a72b.dmp
2016-02-14 22:49:58: minidump.cc:4152: INFO: Minidump not byte-swapping minidump
...
2016-02-14 22:49:58: minidump.cc:2063: INFO: MinidumpModule could not determine version for /system/bin/linker
2016-02-14 22:49:58: minidump_processor.cc:131: INFO: Found 2 memory regions.
2016-02-14 22:49:58: minidump_processor.cc:141: INFO: Minidump tmp/5a5a4c58-3f2f-3ab2-760df4d0-18d1a72b.dmp has CPU info, OS info, no Breakpad info, exception, module list, thread list, no dump thread, requesting thread, and no process create time
2016-02-14 22:49:58: minidump_processor.cc:180: INFO: Looking at thread tmp/5a5a4c58-3f2f-3ab2-760df4d0-18d1a72b.dmp:0/1 id 0x44d
2016-02-14 22:49:58: source_line_resolver_base.cc:236: INFO: Loading symbols for module /system/bin/test_google_breakpad from memory buffer
2016-02-14 22:49:58: basic_code_modules.cc:93: INFO: No module at 0x0
...
2016-02-14 22:49:58: source_line_resolver_base.cc:236: INFO: Loading symbols for module /system/lib/libc.so from memory buffer
2016-02-14 22:49:58: basic_code_modules.cc:93: INFO: No module at 0x7e8d2d64
...
2016-02-14 22:49:58: source_line_resolver_base.cc:236: INFO: Loading symbols for module /system/bin/linker from memory buffer
2016-02-14 22:49:58: basic_code_modules.cc:93: INFO: No module at 0x1
...
2016-02-14 22:49:58: minidump_processor.cc:301: INFO: Processed tmp/5a5a4c58-3f2f-3ab2-760df4d0-18d1a72b.dmp
Operating system: Android
                  0.0.0 Linux 4.1.15+ #1 SMP Sun Feb 7 16:23:42 CST 2016 armv7l
CPU: arm
     ARMv1 ARM Cortex-A9 features: half,thumb,fastmult,vfpv2,edsp,neon,vfpv3,tls
     4 CPUs

Crash reason:  SIGSEGV
Crash address: 0x0
Process uptime: not available

Thread 0 (crashed)
 0  test_google_breakpad!main [test_breakpad.cc : 46 + 0x0]
     r0 = 0x7e8d2cc0    r1 = 0x9d532630    r2 = 0x00000000    r3 = 0x76c1a0b0
     r4 = 0x00000001    r5 = 0xffffffd4    r6 = 0x00000000    r7 = 0x7e8d2d6c
     r8 = 0x00000000    r9 = 0x00000000   r10 = 0x00000000   r12 = 0x54b89f78
     fp = 0x7e8d2d5c    sp = 0x7e8d2c78    lr = 0x54b7f90d    pc = 0x54b80ee4
    Found by: given as instruction pointer in context
 1  test_google_breakpad!main [test_breakpad.cc : 57 + 0x25]
     sp = 0x7e8d2cc8    pc = 0x54b80f3d
    Found by: stack scanning
 2  test_google_breakpad!logger::write [log.cc : 42 + 0x13]
     sp = 0x7e8d2d24    pc = 0x54b80e4d
    Found by: stack scanning
 3  libc.so!__libc_init [libc_init_dynamic.cpp : 115 + 0x7]
     sp = 0x7e8d2d30    pc = 0x76d5246f
    Found by: stack scanning
 4  linker!__linker_init [linker.h : 164 + 0x7]
     sp = 0x7e8d2d60    pc = 0x76f075fb
    Found by: stack scanning

Loaded modules:
0x54b7e000 - 0x54b89fff  test_google_breakpad  ???  (main)
0x76d1c000 - 0x76d3bfff  u:object_r:default_prop:s0  ???
0x76d3c000 - 0x76dc8fff  libc.so  ???
0x76dd1000 - 0x76df3fff  libm.so  ???
0x76df4000 - 0x76e83fff  libc++.so  ???
0x76e85000 - 0x76e93fff  liblog.so  ???
0x76ea3000 - 0x76ea8fff  libnetd_client.so  ???
0x76eae000 - 0x76ecdfff  properties_serial  ???
0x76ed0000 - 0x76eeffff  properties_serial  ???
0x76f00000 - 0x76f43fff  linker  ???
2016-02-14 22:49:58: minidump.cc:4007: INFO: Minidump closing minidump
从这里可以看到是thread 0出现了crash, 并且是由于test_breakpad.cc第46行引起的,我们再看一下test_breakpad.cc文件:
 37 bool DumpCallback(const google_breakpad::MinidumpDescriptor& descriptor,
 38                   void* context,
 39                   bool succeeded) {
 40   printf("Dump path: %s\n", descriptor.path());
 41   return succeeded;
 42 }
 43
 44 void Crash() {
 45   volatile int* a = reinterpret_cast<volatile int*>(NULL);
 46   *a = 1;
 47 }
可以看到,确实是由46行引起的。
- breakpad – 其他
在编译minidump_stackwalk的时候,同时还生成的其他的一些可执行文件:
- build/src/processor/microdump_stackwalk
- build/src/processor/minidump_dump
- build/src/tools/linux/minidump-2-core
- …
也许我们也可以试试in-process中做microdump。
- [2016-02-15 20:26:33] breakpad – NDK build
如果你想使用NDK(android-ndk-r10e-linux-x86_64.bin)进行build, 需要如下patch:
diff --git a/android/google_breakpad/Android.mk b/android/google_breakpad/Android.mk
index 52fa5e4..07daea7 100644
--- a/android/google_breakpad/Android.mk
+++ b/android/google_breakpad/Android.mk
@@ -71,9 +71,13 @@ LOCAL_ARM_MODE := arm
 # List of client source files, directly taken from Makefile.am
 LOCAL_SRC_FILES := \
     src/client/linux/crash_generation/crash_generation_client.cc \
+    src/client/linux/dump_writer_common/seccomp_unwinder.cc \
+    src/client/linux/dump_writer_common/thread_info.cc \
+    src/client/linux/dump_writer_common/ucontext_reader.cc \
     src/client/linux/handler/exception_handler.cc \
     src/client/linux/handler/minidump_descriptor.cc \
     src/client/linux/log/log.cc \
+    src/client/linux/microdump_writer/microdump_writer.cc \
     src/client/linux/minidump_writer/linux_dumper.cc \
     src/client/linux/minidump_writer/linux_ptrace_dumper.cc \
     src/client/linux/minidump_writer/minidump_writer.cc \
@@ -97,4 +101,4 @@ LOCAL_EXPORT_LDLIBS     := -llog

 include $(BUILD_STATIC_LIBRARY)

-# Done.
\ No newline at end of file
+# Done.
同时,如果你打算编译成abi为armeabi-v7a的可执行文件,编译时需要指定APP_PLATFORM为android-21(default: android-3),不然,编译时会报错:
/local/brillo-m9-dev/external/google-breakpad/android/sample_app/jni/../../google_breakpad/../../src/client/linux/minidump_writer/minidump_writer.cc: In member function 'bool {anonymous}::MinidumpWriter::WriteDSODebugStream(MDRawDirectory*)':
/local/brillo-m9-dev/external/google-breakpad/android/sample_app/jni/../../google_breakpad/../../src/client/linux/minidump_writer/minidump_writer.cc:718:20: error: aggregate '{anonymous}::MinidumpWriter::WriteDSODebugStream(MDRawDirectory*)::r_debug debug_entry' has incomplete type and cannot be defined
     struct r_debug debug_entry;
                    ^
/local/brillo-m9-dev/external/google-breakpad/android/sample_app/jni/../../google_breakpad/../../src/client/linux/minidump_writer/minidump_writer.cc:724:23: error: aggregate '{anonymous}::MinidumpWriter::WriteDSODebugStream(MDRawDirectory*)::link_map map' has incomplete type and cannot be defined
       struct link_map map;
                       ^
/local/brillo-m9-dev/external/google-breakpad/android/sample_app/jni/../../google_breakpad/../../src/client/linux/minidump_writer/minidump_writer.cc:744:25: error: aggregate '{anonymous}::MinidumpWriter::WriteDSODebugStream(MDRawDirectory*)::link_map map' has incomplete type and cannot be defined
         struct link_map map;
                         ^
make: *** [/local/brillo-m9-dev/external/google-breakpad/android/sample_app/obj/local/armeabi-v7a/objs/breakpad_client/src/client/linux/minidump_writer/minidump_writer.o] Error 1
附编译命令:
$ export NDK=/path/to/ndk/root
$ ${NDK}/ndk-build APP_ABI=armeabi-v7a APP_PLATFORM=android-21
- breakpad – Crashpad
breakpad会被Crashpad所取代?https://www.chromium.org/developers/crash-reports
The crash reporting system for Google Chrome is called Breakpad, although it is being replaced by Crashpad, which is already in use on some platforms.
Crashpad主页:https://crashpad.chromium.org/index.html
why Crashpad: https://groups.google.com/a/chromium.org/forum/#!topic/chromium-dev/6eouc7q2j_g
Last night, we landed a new crash reporting client for Mac OS X in Chrome. This is the first part of Crashpad, which is is replacing our current crash reporter, the aging Breakpad.
Crashpad became a priority last summer when Apple announced Mac OS X 10.10 (“Yosemite”), which broke interfaces that Breakpad relied on to implement its style of out-of-process crash reporting. Since Apple no longer wanted to support those interfaces, and it wasn’t possible to fix the Breakpad client, we had to switch Chrome to use in-process crash reporting on that OS version. Due to Chrome’s use of sandboxing, in-process crash reporting only worked in Chrome’s browser process. We’ve been in the dark with respect to Mac renderer process crashes on Yosemite, which was released in October 2014.
We’re in the process of building a new Crashpad-enabled canary, 43.0.2331.3, which should be released later today. We’re hoping to bring Crashpad to Mac Chrome 42 soon, since we’re essentially blind to an increasing number of crashes until we’ve shipped it.
The Crashpad Mac client has an entirely new design that enables full out-of-process crash reporting compatible with all Mac OS X versions from 10.6 to 10.10. The new implementation goes beyond Breakpad’s capabilities, and it’s now possible to fully monitor a process for crashes without it needing to be aware of the monitoring. In Chrome, we set up a Crashpad handler early in browser process startup, and it’s inherited by all child processes, including renderer processes. Crashpad also monitors for crashes in a way that catches many things that Breakpad missed, even on earlier OS versions.
If you’re developing on Mac, you may notice Crashpad is always built into Chromium, a departure from how Breakpad was integrated. You may also notice that a new executable named crashpad_handler runs whenever Chrome is open. crashpad_handler will always monitor Chrome processes for crashes, and will handle them by writing crash dumps. Crash reports aren’t uploaded to a collection server unless the crash reporting opt-in checkbox is enabled, which is only possible in official builds. This crash monitoring does not interfere with debugging in any way, another improvement over Breakpad. crashpad_handler exits once all processes it’s monitoring have exited, unless it’s in the middle of an upload, in which case it will wait for the upload to finish.
Another major difference from Breakpad is that Crashpad has very full test coverage, where Breakpad had nearly no test coverage. While Crashpad is composed of a lot of brand-new code, it’s code that I have much more confidence in than what it’s replacing.
We’re actively working on bringing the Crashpad client to Windows, along with many more improvements. We have plans to replace other Breakpad components such as the crash report processor as well. I’m hopeful that all parts of Crashpad and all of its users will benefit from this more robust platform with increased test coverage and a clean design inspired by nine years of experience with its predecessor.
If you’re interested, the project home is https://crashpad.googlecode.com/ (for now).
Buckle up!
Mark
(with thanks to rsesek and scottmg)
- breakpad – gdb
除了可以将dmp文件使用minidump_stackwalk进行解析之外,我们还可以将dmp文件通过minidump-2-core转换与gdb能够识别的core dump文件。具体请看相关的文档:https://www.chromium.org/chromium-os/packages/crash-reporting/debugging-a-minidump
Use gdb to show a backtrace
Generate core file
Convert a minidump to a core file.
sh -c ‘~/chromiumos/chroot/usr/bin/minidump-2-core -v upload_file_minidump-7adc2ee0079cb374.dmp > minidump.core 2>minidump.core.out’
For a minidump from a 32-bit executable, use minidump-2-core.32 instead.For an ARM minidump, you have to work a little bit harder to get a core file. The easiest way is probably to do the conversion using qemu within your chroot.
# Convert minidump to a core file in /tmp/
SYSROOT=/build/daisy
qemu-arm \
${SYSROOT}/lib/ld-linux-armhf.so.3 \
–library-path ${SYSROOT}/lib:${SYSROOT}/usr/lib \
${SYSROOT}/usr/bin/minidump-2-core \
-v ~/test/upload_file_minidump-de1f11232d825812.dmp >/tmp/minidump.core 2>/tmp/minidump.core.out
Reference: http://crosbug.com/34938Calculate address for symbols
First, setup the necessary files for the debugger. You need both the original executables and/or libraries whose symbols you wish to calculate, and you will need their corresponding debug information. Googlers: See Setup files for debugger for how to get these for official images.
Calculate the base address of the crashing executable’s .text section.
# Determine base address where the crashing executable was mapped
set t1=`grep -w GUID minidump.core.out | grep ‘”/opt/google/chrome/chrome”‘ | sed -e ‘s/-.*//’`
# Determine offset of .text within the executable (run objdump with sudo if setuid program like Xorg)
set t2=`objdump -h /usr/local/google/home/mkrebs/tmp/test/sigabrt/2913.45.0/image/rootfs/opt/google/chrome/chrome | \grep ‘\.text’|awk ‘{print $4}’`
# Print out address of .text in memory
perl -e ‘die unless $ARGV[0] && $ARGV[1]; printf(“%#x\n”, hex($ARGV[0]) + hex($ARGV[1]))’ $t1 $t2You may also want to do this for shared libraries that the executable loaded.
# Determine base address where the library was mapped
set t1=`grep -w GUID minidump.core.out | grep ‘”/lib/libc-2.15.so”‘ | sed -e ‘s/-.*//’`
# Determine offset of .text within the executable (run objdump with sudo if setuid program like Xorg)
set t2=`objdump -h /usr/local/google/home/mkrebs/tmp/test/issue35349/2913.84.5/image/rootfs/lib/libc-2.15.so | \grep ‘\.text’|awk ‘{print $4}’`
# Print out address of .text in memory
perl -e ‘die unless $ARGV[0] && $ARGV[1]; printf(“%#x\n”, hex($ARGV[0]) + hex($ARGV[1]))’ $t1 $t2Googlers: Alternatively, you can try my generate_gdb_command_file script to automatically generate a gdb command file for adding all the symbol files. For the “–top” command-line option, specify the path to where your image is mounted. Then, pass the path to the file to which you redirected minidump-2-core’s stderr.
/home/mkrebs/bin/scripts/generate_gdb_command_file –top 2913.84.5/image/rootfs/ ~/checkouts/cros/cros6/chroot/tmp/minidump.core.out > minidump.gdbStart debugger
Run gdb on the core file.
gdb –core minidump.core
armv7a-cros-linux-gnueabi-gdb –core minidump.coreMap executable’s symbol file to base address of .text section.
(gdb) add-symbol-file <path to top-level “debug” directory>/<path to .debug file> <address from calculation>Googlers: Alternatively, if you tried my generate_gdb_command_file script, use the generated gdb command file to add all the symbol files.
gdb –core minidump.core –command minidump.gdbExample
grep -w GUID minidump.core.txt | grep ‘”/opt/google/chrome/chrome”‘ | sed -e ‘s/-.*//’
0x72CC9000
objdump -h /usr/local/google/home/mkrebs/tmp/test/sigabrt/2913.45.0/image/rootfs/opt/google/chrome/chrome | \grep ‘\.text’|awk ‘{print $4}’
002a73e0
perl -e ‘printf(“%#x\n”, hex($ARGV[0]) + hex($ARGV[1]))’ 0x72CC9000 002a73e0
0x72f703e0gdb –core=minidump.core
(gdb) add-symbol-file /usr/local/google/home/mkrebs/tmp/test/sigabrt/2913.45.0/debug/opt/google/chrome/chrome.debug 0x72f703e0If backtrace in gdb did not help
Sometimes, the gdb backtrace command (Use gdb to show a backtrace) doesn’t show a stack trace any better than that of minidump_stackwalk (Use minidump_stackwalk to show a stack trace). If you think there’s more to it than what those two are showing you, try this method to naively dump all the known symbol addresses seen on the stack. You’ll see some false positives, but you may just find the name of a function that seems like a plausible place to look.
First, start from the above step of using gdb to show a backtrace. We can reuse the gdb command file that was generated for it. Googlers: If you didn’t use my generate_gdb_command_file script, you can manually create the gdb command file containing any “add-symbol-file” commands you ran.
Second, determine the base address of the stack. The easiest way is to just look at the stack address in the minidump. This command will set the $sp_addr variable to the stack address of the first thread in the minidump:
set sp_addr=`~/checkouts/cros/cros6/chroot/usr/bin/minidump_dump upload_file_minidump-62893577d8a73070.dmp | perl -ne ‘s/^ stack.start_of_memory_range = // && print && exit’`If you want to be smarter, you can run minidump_stackwalk on the minidump (using the appropriate Breakpad symbols) and skip past any stack frames you can assume are accurate. You would do this by looking for the stack pointer of the last consecutive call frame found by “call frame info”. For example, for issue http://crosbug.com/35531 the stack pointer value would be 0x7e8b3440 given the following top-most (i.e. higher address) frames:
7 Xorg!OsSigHandler [osinit.c : 146 + 0x11]
r4 = 0x76fc9f7c r5 = 0x7e8b3440 r6 = 0x76bfb094 r7 = 0x00000000
r8 = 0x00000000 r9 = 0x00000020 r10 = 0x00000004 fp = 0x00000008
sp = 0x7e8b3430 pc = 0x76f90949
Found by: call frame info
8 libc-2.15.so + 0x25e6e
r4 = 0x774ec898 r5 = 0x76e9aeb8 r6 = 0x76bfb094 r7 = 0x00000000
r8 = 0x00000000 r9 = 0x00000020 r10 = 0x00000004 fp = 0x00000008
sp = 0x7e8b3440 pc = 0x76b40e70
Found by: call frame info
9 libc-2.15.so!new_do_write [fileops.c : 537 + 0x11]
sp = 0x7e8b345c pc = 0x76b6abe5
Found by: stack scanningFinally, run the following gdb command to dump 1024 words of the stack (i.e. potential addresses). In the output, for any value that corresponds to a known symbol, gdb will annotate it with the symbol’s name in angle brackets. Knowing that, we can simply pipe the output to something (in this case, perl) to pull out any annotation it finds in the stack dump.
gdb –core minidump.core –batch –command minidump.gdb –eval-command “x/1024aw $sp_addr” |& perl -ne ‘$re=qr{(<((?:[^<>]++|(?-2))*+)>)}; print “$2\n” while (s/0x[0-9a-f]+ $re//)’
相关的参考文档:
- https://chromium.googlesource.com/breakpad/breakpad/
- https://chromium.googlesource.com/breakpad/breakpad/+/master/docs/
- https://chromium.googlesource.com/breakpad/breakpad/+/master/docs/linux_starter_guide.md
- https://www.chromium.org/developers/decoding-crash-dumps
- http://dev.chromium.org/developers/crash-reports#TOC-Working-with-Minidumps
- https://www.chromium.org/chromium-os/packages/crash-reporting/debugging-a-minidump